UEH has implemented a systematic program to measure and monitor food waste generated from canteens, cafeterias, and on-campus food service areas. Data collection is conducted in collaboration among the UEH Infrastructure Management Board, cleaning staff, and contracted food service providers.
Food waste monitoring at UEH goes beyond data measurement — it serves as a foundation for developing and implementing waste reduction initiatives across the university. Based on actual data, UEH has launched several initiatives, including communication campaigns to reduce leftover portions, programs promoting safe food reuse, and research on composting models for organic waste management. Through these initiatives, food waste monitoring not only provides transparency and accountability but also drives sustainable behavioral change, aligning with UEH’s vision of a “UEH Green Campus.”
I. General information
+ Implementing units: UEH Green Campus Project & UEH Youth Union – Student Association
+ Scope of monitoring: Entire UEH campus (including facilities A, B, V, N, Dormitory 135, Dormitory 43–45, etc.)
+ Sources of food waste: Canteens, cafeterias, contracted food vendors, and leftover food collection bins at UEH Green Practice Stations.
| Campus | Canteen | Cafeteria | Outsourced catering services |
| A | None | None | X |
| B | X | None | None |
| N | None | X | X |
| V | X | X | |
| Dormitory 135 | None | None | None |
| Dormitory 43 – 45 | None | None | None |
II. Monitoring methodology
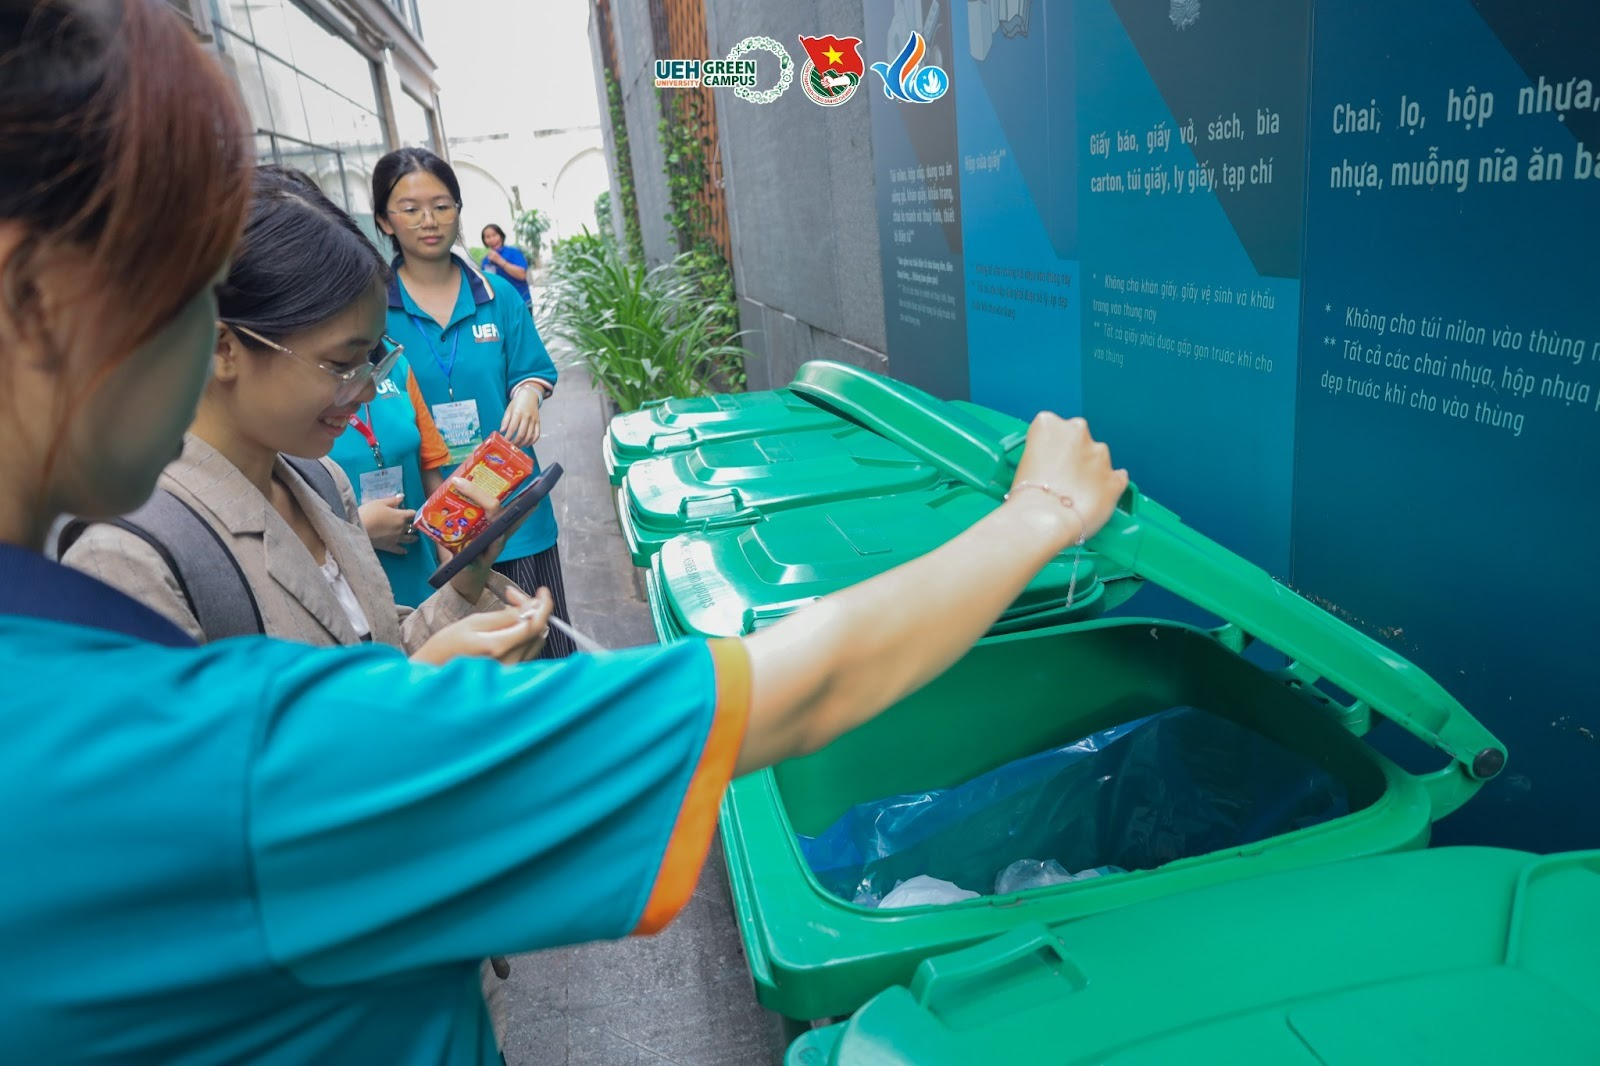
1. Source separation of waste: Food waste is separated from recyclable and residual waste in accordance with the “Regulations Regarding Green Campus Practice”.
2. Measurement: Daily waste weight is measured using electronic scales or digital measuring devices installed at designated collection points.
3. Data recording: Data are logged daily using standardized forms and aggregated on a weekly and monthly basis for trend analysis and reporting.
4. External food service vendors: For outsourced food service providers, waste data are submitted in compliance with contractual agreements and verified by the Infrastructure Management Board.
III. Monitoring data
1. Volume of food waste generated (kg) from September 2023 to June 2024.
| Month | A | B | V | N | Dormitory 135 | Dormitory 43-45 | TOTAL |
| 09/2023 | 325 | 693 | 359 | 772 | 582 | 272 | 3003 |
| 10/2023 | 343 | 758 | 394 | 762 | 612 | 325 | 3194 |
| 11/2023 | 291 | 659 | 325 | 846 | 699 | 360 | 3180 |
| 12/2023 | 243 | 592 | 253 | 719 | 544 | 302 | 2653 |
| 01/2024 | 205 | 268 | 188 | 323 | 268 | 242 | 1494 |
| 02/2024 | 290 | 461 | 294 | 618 | 575 | 294 | 2532 |
| 03/2024 | 305 | 575 | 304 | 642 | 557 | 319 | 2702 |
| 04/2024 | 241 | 506 | 291 | 760 | 608 | 320 | 2726 |
| 05/2024 | 249 | 584 | 238 | 548 | 597 | 273 | 2489 |
| 06/2024 | 203 | 456 | 204 | 510 | 547 | 245 | 2165 |
| TỔNG | 2695 | 5552 | 2850 | 6500 | 5589 | 2952 | 26138 |
Illustrative images from waste classification activities at the source and the waste weighing system.